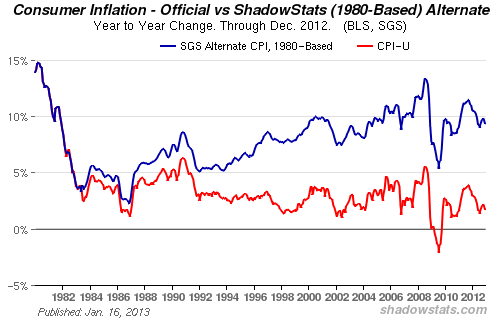
CHART SHOCK: The REAL Inflation Rate Is 10%

UPDATE - The chart above has been updated to include data for December, showing the true CPI at just under 10%.
---
If the CPI were still calculated as it was in the 1980s under Paul Volcker, it would show a very different picture of inflation than what is promulgated by Chairman Bernanke.
The CPI on the Alternate Data Series tab here reflects the CPI as if it were calculated using the methodologies in place in 1980. In general terms, methodological shifts in government reporting have depressed reported inflation, moving the concept of the CPI away from being a measure of the cost of living needed to maintain a constant standard of living. Further definition is provided in our CPI Glossary.
---
History of the CPI
By John Melloy
Executive Producer, CNBC's Fast Money
After former Federal Reserve Chairman Paul Volcker was appointed in 1979, the consumer price index surged into the double digits, causing the now revered Fed Chief to double the benchmark interest rate in order to break the back of inflation. Using the methodology in place at that time puts the CPI back near those levels.
Inflation, using the reporting methodologies in place before 1980, hit an annual rate of 9.6 percent in February, according to the Shadow Government Statistics newsletter.
Since 1980, the Bureau of Labor Statistics has changed the way it calculates the CPI in order to account for the substitution of products, improvements in quality (i.e. iPad 2 costing the same as original iPad) and other things. Backing out more methods implemented in 1990 by the BLS still puts inflation at a 5.5 percent rate and getting worse, according to the calculations by the newsletter’s web site, Shadowstats.com.
“Near-term circumstances generally have continued to deteriorate,” said John Williams, creator of the site, in a new note out Tuesday. “Though not yet commonly recognized, there is both an intensifying double-dip recession and a rapidly escalating inflation problem. Until such time as financial-market expectations catch up with underlying reality, reporting generally will continue to show higher-than-expected inflation and weaker-than-expected economic results in the month and months ahead.”
---

 Jan 26, 2013 at 1:34 PM
Reader Comments (5)
A good way to measure inflation without the help of the mysterious Mr. Williams is just to calculate it off the national debt.
I call it the NDIR (National Debt Inflation Rate.) You can look year to year or the rate since whenever. The government itself publishes the raw numbers as a running total at: http://www.treasurydirect.gov/NP/BPDLogin?application=np
Since April of 2009, the inflation rate is averaging 12.3% per year. No hocus pocus, just simple numbers. Of course, this isn't the whole accounting of government obligations but it is a quick and easy inflation rate approximation.
Then they can print as much money as they want without CPI or COLA equations getting in the way!
Problem solved, right?
---
Exactly. CNBC often talks about the great inflation of the late 70s and early 80s, but if you apply the same measure, today's inflation is getting close to that mark.