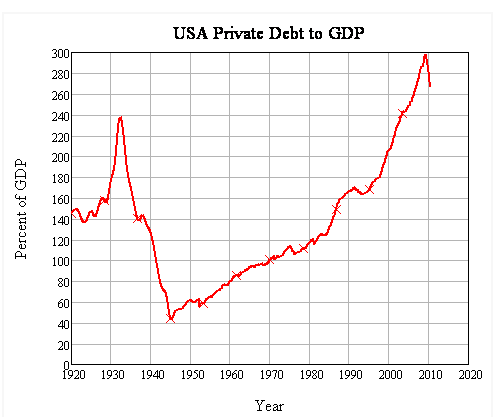
One glance at this beauty shows that consumers have barely begun the process of deleveraging. It's going to be several more years before household balance sheets are repaired and ready to assume more debt. Hello, Tokyo.
12 more charts below.
---
By Steve Keen, Associate Professor of Economics & Finance at the University of Western Sydney, and author of the book Debunking Economics.
The aggregate data is unambiguous: the US economy is delevering in a way that it hasn’t done since the Great Depression, from debt levels that are the highest in its history. The aggregate private debt to GDP ratio is now 267%, versus the peak level of 298% achieved back in February 2009–an absolute fall of 31 points and a percentage fall of 10.3% from the peak.
Read Dr. Keen's full article (more charts and analysis):
---
Chart archive:
---