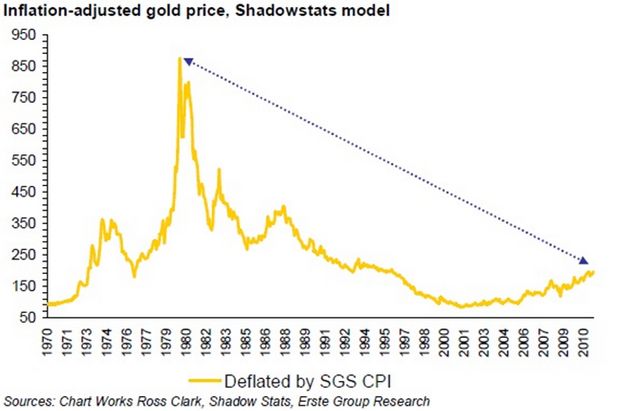
We still have a long way before we catch up with the 1979 inflation adjusted highs.
Since Nixon's move, the U.S. dollar has fallen from 1/35th of an ounce of gold to 1/1750th of an ounce of gold today.
Here's another view.

---
Bizarre clip. Profanity warning.
Further reading:
Tungsten Plated Gold Bars - Bob Chapman Implicates Rubin & Summers
Gold Bar Testing With Ultrasound (VIDEO)
Video: Counterfeit Engelhard 100 Ounce Silver Bars
The Gold Confiscation Act Of 1933
Texas Wants Its Gold Back From The Fed
Watch Tricky Dick End The U.S. Gold Standard (1971)