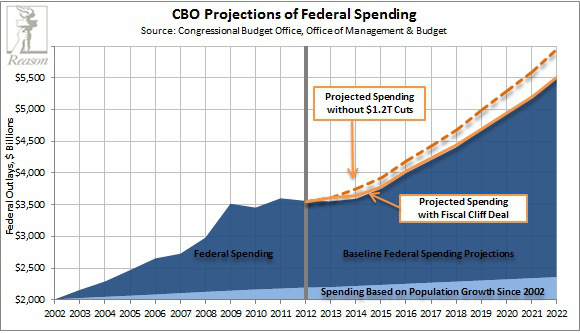
A fiscal cliff drop in the bucket.
CHART - CBO Projection Of Federal Spending 2002 - 2022.
Just a quick chart to demonstrate that the fiscal cliff deal on taxes means essentially nothing in the grand scheme of future federal spending. Chart is from the following story:
Jobs Report - U6 Rate Holds at 14.4%, Actual Employment Falls to 58.6%
---
UPDATE - Blink! U.S. Debt Just Grew by $11 Trillion