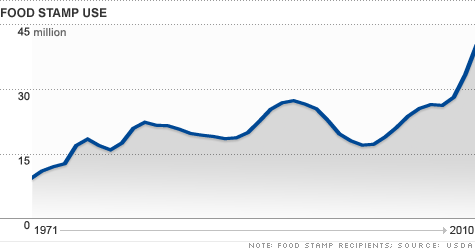

Most interesting about the longer term chart (1970-2011) is the fact that the program is hard to escape. Once a family starts on food stamps, the chance of getting off the program is slim.
NEW YORK (CNNMoney) -- Nearly 15% of the U.S. population relied on food stamps in May, according to the United States Department of Agriculture.
The number of Americans using the government's Supplemental Nutrition Assistance Program (SNAP) -- more commonly referred to as food stamps -- shot to an all-time high of 45.8 million in May, the USDA reported. That's up 12% from a year ago, and 34% higher than two years ago.
To qualify for food stamps, an individual's income can't exceed $1,174 a month or $14,088 a year -- an amount that is 130% of the national poverty level.
The average food stamp benefit was $133.80 per person and $283.65 per household in May.
---
Related stories:
Time Lapse Video - Food Stamps Are The New Normal
WSJ Interactive Map - Food Stamp Use By State
J.P. Morgan's Food Stamp Monopoly: The More Americans That Fall Into Poverty The More Money Jamie Dimon Makes